Test Runs
Understanding and managing test executions
Test Runs
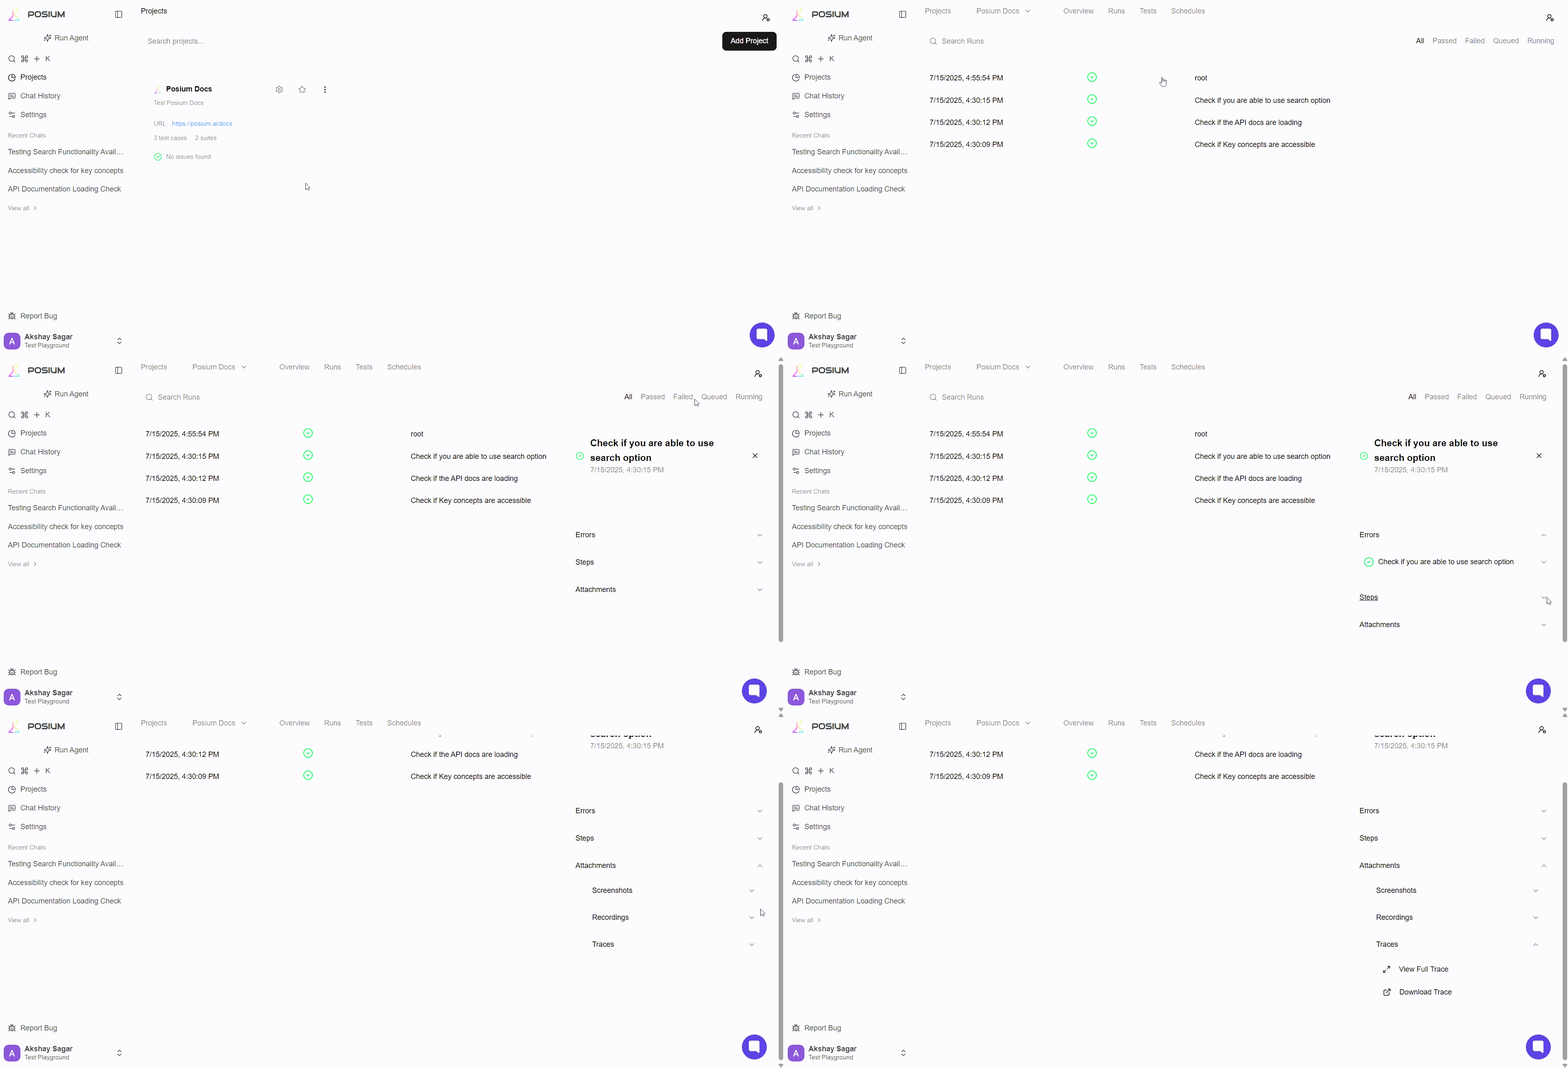
The Test Runs section in Posium is your central hub for monitoring the outcomes of your automated test executions. It allows you to quickly identify issues, track overall test performance, and gain deep insights into the behavior of your application. Each test run provides comprehensive logs, relevant screenshots, and detailed error reports, enabling rapid diagnosis and efficient troubleshooting of any failures encountered during execution.
Accessing and Navigating Test Runs
-
Select Your Project: To view test runs, click on the specific project you wish to analyze. Upon selection, you will typically land directly on the "Test Runs" overview for that project.
-
Filter Test Runs: On the top right side of the Test Runs interface, you'll find options to filter the displayed results. This allows you to quickly narrow down runs by their status:
- All: Display all test runs regardless of their outcome.
- Passed: Show only tests that completed successfully.
- Failed: Display only tests that encountered failures.
- Queued: View tests that are waiting to be executed.
- Running: See tests that are currently in progress.
-
Overview of Each Run: Each entry in the test runs list will provide a concise overview, including:
- Date and Timestamp: When the test run occurred.
- Status: The current state or final outcome (e.g., Pass, Fail, In Progress).
Detailed Test Run Analysis
Clicking on an individual test run will reveal a more detailed view, providing all the necessary information for comprehensive debugging and analysis. This detailed view typically includes:
-
Errors: This section highlights any errors or exceptions encountered during the test run, specific error messages to help pinpoint the cause of failure.
-
Steps: A chronological breakdown of each step performed by the test. This allows you to trace the exact sequence of actions and verify where a test might have deviated from its expected path.
-
Attachments: This crucial section provides visual and technical artifacts from the test execution:
- Screenshots: A final screenshot taken at the conclusion of the test, or at the point of failure, offering a visual snapshot of the application's state.
- Recordings: (WIP - Work In Progress) This feature will provide a video recording of the test run, offering a dynamic view of the execution flow.
- Traces: A highly detailed trace file that includes comprehensive logs, network calls, performance metadata, and other valuable debugging information. This is an invaluable resource for in-depth troubleshooting.

Test Environment Resource Allocation
Our automated tests run within a containerized environment managed by Kubernetes. This means tests aren't executed on a single, fixed machine, but rather within isolated units called pods, which are dynamically allocated resources from a cluster of underlying servers.
To ensure consistent and performant test execution, we define specific resource guarantees for each pod:
Browser Pod
This pod hosts the web browser instance used for testing.
- CPU:
1 vCPU - Memory:
2 GiB
Test Runner Pod
This pod executes the test logic, orchestrates browser interactions, and processes results.
- CPU:
2 vCPUs - Memory:
8 GiB
Note:These specifications represent the guaranteed resources available to each pod. While the underlying Kubernetes worker nodes (the physical or virtual machines) have larger, shared resource pools, the defined pod allocations ensure a predictable and stable environment for our testing processes.